Struggling with data validity and complex business rules, the firm was able to accelerate ROI as a result of improved control and understanding of their data and systems.
“We are infinitely closer to understanding and acting upon Big Data now.” – Head of Business Intelligence
C L I E N T P R O F I L E
Leading US-based global bio-pharmaceutical giant addressing 170 unique markets
I N T R O D U C T I O N
This firm sought an efficient and transparent visualization process to support their growing data needs and gain a competitive sales and market advantage using agile business analytics for big data.
C H A L L E N G E S
- Unravelling and correctly reallocating the performance of their direct and wholesale sales approach.
- Understanding the growing discrepancy of their sales versus target KPIs.
- Growing complexity of using SQL to apply their business logic.
- Frustrations in using a 3rd party data service provider.
- The reactive culture of addressing data validation requests and errors.
- Attrition and turnover on the firm’s development team.
- Explicit lack of confidence in data quality and accuracy by key decision makers.
M A T E R I A L B E N E F I T S
Efficiency
Significantly reduced SQL development costs.
Accelerated ROI.
Agility
Business analysts can now implement immediate changes to input variables and produce accurate current and past data outputs of an assortment of formats, including Excel and Qlik – rather than relying on a 3rd party service provider.
Transparency
The complementary techniques of the visualization process which highlights data issues in Qlik, with the associated corrected logic in the embedded in Lavastorm not only re-established data trust, but also provided a “whiteboard” view of their data to the business users.
S O L U T I O N
Changes in business logic, or requests for different views of the SQL tables, required an extensive development effort, incremental costs, as well as independent
data validation reporting tools – making it impossible to foster an agile and responsive service needed to stay on pace with the evolving business landscape.
Pomerol Partners, a best in class global data visualization consultancy, first digested the requirements, then wire-framed and implemented a solution in a collaborative technology apporach. This allows seamless data preparation and analysis – first visualizing (Qlik) all the data and then transforming (Lavastorm) all of it, with a proof of concept ready and confidence restored in just 20 days.
“We were daunted by the project; that was until we saw Lavastorm and realised we could now untangle the data spaghetti.” – Project Manager
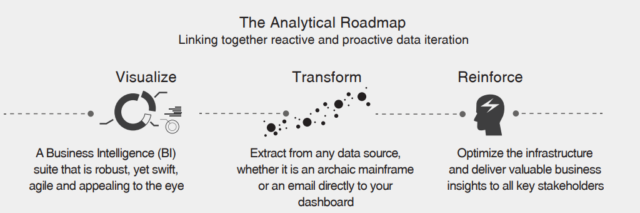
V I S U A L I Z A T I O N
An initial implementation of true and best-in-class Qlik dashboards highlighted data quality and reference issues in the underlying SQL source, while bringing all pain points to light. The Pomerol Partners approach enabled users to gauge the holistic quality of the business’ data and started reigniting their trust in the data, rather than ignoring, adjusting or simply removing them. A Qlik based cross-dimensional patient and sales driver application allowed users to produce over 100 multivariate approaches in just 5 clicks. This gives clear guidance on producing the highest likelihood of closing value-positive deals.
Sales executives finally received validation for their data-scripting concerns. Furthermore, agile and visual-based dashboards accelerated their ability to produce daily results. From there, Pomerol Partners swiftly narrowed down inaccurate data logic and opaque data sets, enabling executives to run cost-benefit scenarios to set priority for their data transformation approach.
T R A N S F O R M A T I O N
The Lavastorm Analytics Engine (“LAE”) was then deployed on the prioritized and focused operating areas- sales CRM, Direct Sales and Finance data. The steepest data transformation challenge was to replicate complex business logic that calculated both patient and product attribution. This was not only mapped, but completed within 10 working days.
The LAE solution was then applied to retrospective data sets to produce historic figures and management information (“MI”) accurately for the first time. This
transformation enabled the business users to truly ‘see’ their business logic for the first time since SQL scripts “hid” it from them.
As a result, the agile Lavastorm solution provides an ability to rapidly change input assumptions and produce an understanding of historic output. The business logic transparency re-established the trust in the numbers while also dynamically filtering through to the newly established Qlik visualization solution.
“Working with consultants who understood our business, made all the difference.” – Head of CRM
More Insights
-
Qlik to Power BI Migration

-
Client Product Reporting in FX Sales & Trading

-
Consolidating Financials for Multiple Acquisitions

-
How Machine Learning Can Transform the Financial Sector in 2024

-
Tracking Key Business Metrics using Power BI

-
Update on the future of Talend Open Studio

-
Multinational Bank’s Need of Fluid Understanding for their FX Pricing

-
Building a Single View of a Customer’s Portfolio to Support Regulatory Compliance

-
Exploring Change Data Capture (CDC)

-
🔍 Excel vs. BI Tools: Why It's Time to Evolve Your Data Strategy