Last year when my wife launched SendACarePackage.com, an e-commerce site for sending high quality care packages to college students, I became the de-facto CIO. Our search for an e-commerce platform led us to pick Woocommerce*.
Once we launched the site and built some sales history we knew we needed to analyze the data. We needed to know what products were selling so we could control inventory and expand product lines. We also needed to know how much to spend on advertising. And we wanted to see if people were using custom features we built into Woocommerce.
We needed something that would get us answers fast without having to spend a ton of time or money. As the leader of the Qlik Practice for Pomerol Partners (one of Qlik’s largest resellers), I was naturally inclined to select Qlik Sense, the latest offering by Qlik, for the task; thankfully I wasn’t disappointed when my wife’s business was on the line.
Since Woocommerce is built on WordPress, it stores data in a way that’s difficult to report on. In developer speak, it stores the data in attribute/value records. For example, each order has a whole bunch of records like these:
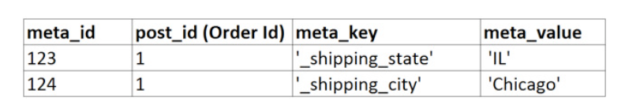
Mind you, this is just a couple of attributes for a single order. Imagine that for 50 or more attributes of an order: customer name, bill to, ship to, order date, amount, shipping, etc. for a whole bunch of orders. Then do the same thing for product attributes and other data you’d want to report on.
This meant I had to transform the data to report on it. The transformation would have been difficult to impossible with other tools. With Qlik Sense it was as simple as using the GENERIC keyword in my load statement; no data warehouse needed. I’m not a hardcore developer so I did get some help from the Qlik Community here:https://community.qlik.com/blogs/qlikviewdesignblog/2014/03/31/generic
Now that I had my data transformed I was able to create a few dashboards to help my wife run her business. Through the power of the associative data model some interesting things came to light and we were able to:
- Tweak Adwords Strategy: First and foremost – My wife was right and I was wrong aboutExam Cram care packages. I insisted that sales would hold up well into May. What we found was that sales were strongest in April, followed by December. No sense in spending money on google adwords in May. That would have saved us a lot on our adwords spending. Next year we’ll know.
- Identify Best Performing Products: People spend more on get well care package gifts than other occasions. I was able to search for “Get Well” and found all of the orders that included a “Get Well Balloon” add-on OR a “Get Well Care Package”. This allowed me to better track sales and to count them as get well gifts even if they didn’t order a get well care package per se.
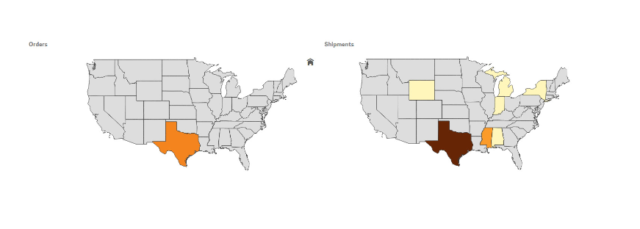
- Analyze Customers and Transactions Across Geographic Markets: Using a map of Bill To addresses and a map of Ship To addresses we’re able to see that most Texans go to school in Texas but there are quite a few in Mississippi too. Generally speaking most orders were intrastate. We can use this to plan our next warehouse locations based on schools we do business with. That will save a lot on shipment times and costs.
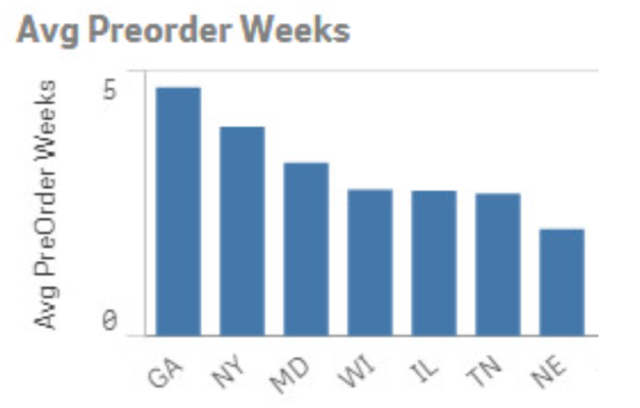
- Align Inventory with Customer Demand: We allow users to pick a ship date in the future, e.g. you can order an exam care package in September and have us ship it for finals in December. Interestingly, people from Georgia plan ahead the most, followed by New Yorkers. This is based on the difference between the order date and the shipment date. Knowing this information helps us plan our inventory and marketing efforts.
-
- Increase Profits by Identifying Best Add-On Product: “Bitch Slap Those Germs” (hand sanitizer) was the most popular add-on. Apparently parents never stop thinking their kids’ hands are dirty.
- Align the Right Mix of Products: We have 3 product levels: Care, Care More, Care Most. Apparently nobody cares more… The “Care More” SKUs didn’t break the top 7 in order quantity OR sales volume.
By uncovering these facts, my wife and I were able to refine our product offerings, better manage inventory, align the right mix of products, be more strategic in our marketing efforts, and rearrange our website to increase sales. We’re excited to continue building on the dashboard. As we add in affiliate tracking, google analytics data, and more, I will keep updating the app and keep posting here. Of course, as a startup, I have to be careful what I share but I am happy to talk to any non-competitors in detail about how to connect to Woocommerce so you can start visualizing your data and how those visualizations can help you make better decisions.
To find our more about how Pomerol Partners and Qlik Sense can help you leverage your data visit the Pomerol Partners website here.
*According to builtwith.com Woocommerce is the most popular ecommerce platform (http://trends.builtwith.com/shop select entire internet).
More Insights
-
Qlik to Power BI Migration

-
Client Product Reporting in FX Sales & Trading

-
Consolidating Financials for Multiple Acquisitions

-
How Machine Learning Can Transform the Financial Sector in 2024

-
Tracking Key Business Metrics using Power BI

-
Update on the future of Talend Open Studio

-
Multinational Bank’s Need of Fluid Understanding for their FX Pricing

-
Building a Single View of a Customer’s Portfolio to Support Regulatory Compliance

-
Exploring Change Data Capture (CDC)

-
🔍 Excel vs. BI Tools: Why It's Time to Evolve Your Data Strategy