Whilst not fit for every application, our team has found that presenting the use of a dual calendar in an application takes it to the next level regarding analytical capability. Lets have a brief look at two different methods of deploying a dual calendar (they both use the same methods but have different selection boxes).

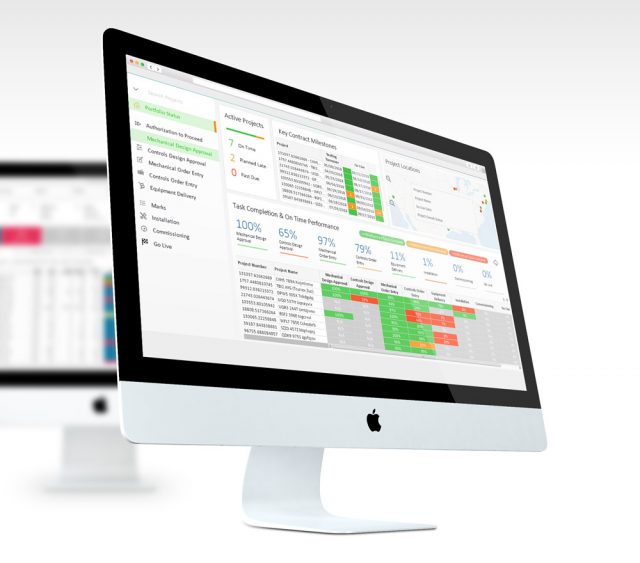
Fig 1 – example of a dual calendar with quarter-on-quarter comparison.
This setting is a popular configuration, especially for management and income statement type applications. In the above diagram, we have a quarter-vs-quarter comparison, however the configuration options are endless – see below for examples.

Fig 2 – example of a dual calendar with year-on-year comparison for a selected month.
![]()
Fig 3 – example of a dual calendar with Year-to-date comparison against the prior year.
The user quickly starts to appreciate that the comparable opportunities are now endless. This is an example of one of many functions that take an application to the next level and really brings out the power of Qlikview. Typically a dual calendar really starts to drive what Qliktech used to call “data discovery” however that has reduced significantly since the introduction of Qliksense and race against Tableau for “visualisation” over functional benefits.
Displaying the Comparisons
Comparisons are built in the chart tables, often with a “Delta” or change column. An example is below, with the dynamic sort enabled in the chart the user can sort by current, comparable or even the change.
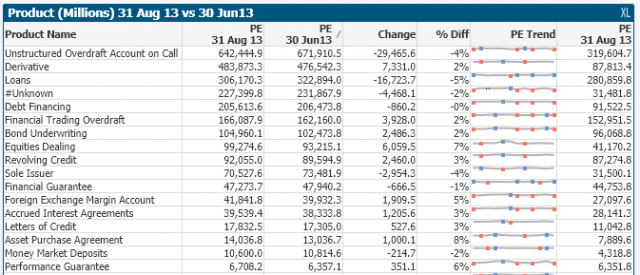
Fig 4 – example of displaying comparative data
Another method of the use subtle but effective delta indicators in KPI boxes.
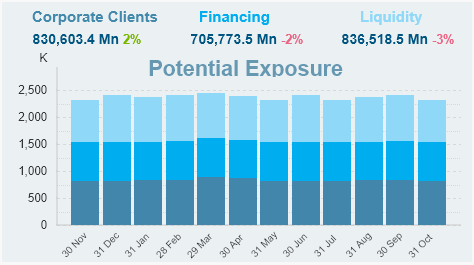
Fig 5 – example of putting the comparative date in subtle but highly visual KPI boxes (green and pink)
Technical Implementation – the use of data islands
There are many ways to implement a dual calendar, however the safest and most straight forward is to completely isolate both the current and prior calendar into data islands. Selections from these data islands are then passed into variables that drive set analysis.
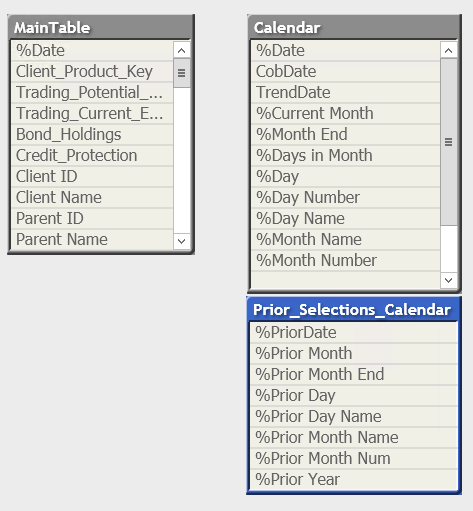
Fig 6 – simplified example of data islands for the calendars (note that both current and prior tables are not linked to any other tables, they are essentially island tables with no links)
Here is an example of the code for creating the current and prior (comparative) islands from the main fact table in your data model. Typically, this code is placed at the end of a load script. In this example the source table has no missing dates in the table, however if there are missing dates this can be resolved with additional code to autogenerate dates for the calendar.
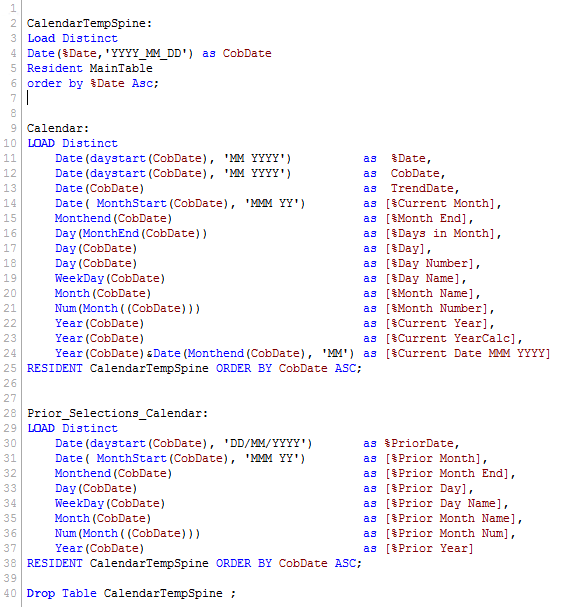
Constricting the date variables from the data island selections
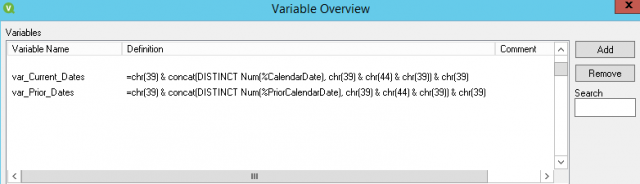
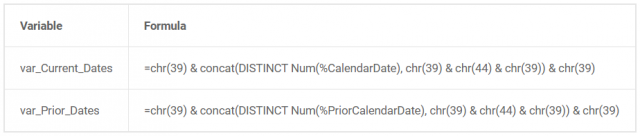
To pass the date selections into set analysis, again there are a number of ways. The most simplified way is to use actual days. In this example, days are the most granular measure in the calendar (as opposed to months, quarters & years), so the aim will be to collect the days that relate to a selected year / quarter / month into a string – we can then pass this string into set analysis. The function to do this is the Concat function.
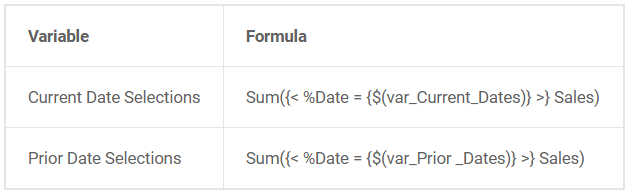
Once the above has been created then normal set analysis can be applied against any instance of a date occurring on the application datamodel. The following are examples
Final Comment and Notes
The use of dual calendars is not standard, native Qlik functionality but it is easily achievable and leads to analytical reporting instead of standard report outputs. There are a number of debates on the Qlik Community regarding the use of data islands and whilst their use is very helpful one needs to also be aware of the memory pitfalls of calendar islands, especially on applications with already badly designed data models.
More Insights
-
Qlik to Power BI Migration

-
Client Product Reporting in FX Sales & Trading

-
Consolidating Financials for Multiple Acquisitions

-
How Machine Learning Can Transform the Financial Sector in 2024

-
Tracking Key Business Metrics using Power BI

-
Update on the future of Talend Open Studio

-
Multinational Bank’s Need of Fluid Understanding for their FX Pricing

-
Building a Single View of a Customer’s Portfolio to Support Regulatory Compliance

-
Exploring Change Data Capture (CDC)

-
🔍 Excel vs. BI Tools: Why It's Time to Evolve Your Data Strategy