Where are we with COVID? How are we doing with testing and tracking? Are we managing to do a better job as a society to curb the spread of this virus? Let’s take a look into the data in a quick and easy way to form our own opinions.
DISCLAIMER – It is important to note that US states and territories report data in varying units and definitions. The values seen are simple sums of the data that states and territories have provided. Due to the disparate metrics, the values should be considered estimates.
In doing research and tracking down public data from various organizations, I was able to compile a few spreadsheets, either using APIs or directly loading in the files using Qlik’s data load editor to do some exploration.
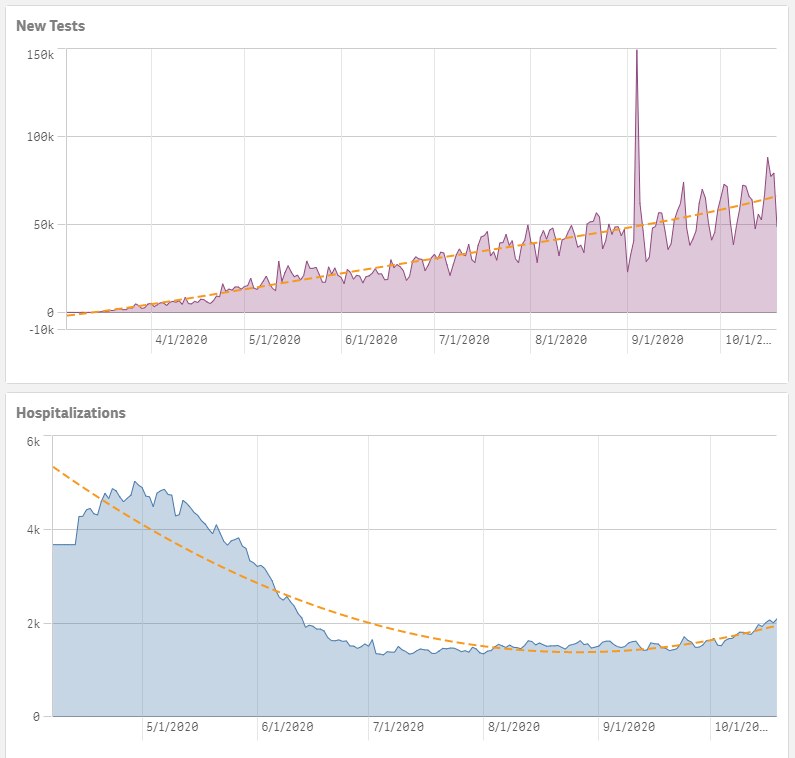
In Illinois (where I live), we can see that the number of new tests is going up as each day passes. The number of hospitalizations and deaths related to COVID are trending downwards, however they are still too high for comfort. With more individuals getting tested as the cold/flu season approaches, we would expect the amount of testing to increase and possibly the number of new cases to increase as well. When viewing the data, we can see just that. We can also see an interesting spike right around Sept 3rd. Why is that? Well, hard to say exactly, but being a Chicago native I some have tribunal knowledge and could tell you that everyone went down to the harbor to get out of the house and enjoy Labor Day weekend. @Chicagoans – was it worth it? Looking at the data, no. Although many people did decide to get tested, there was a huge spike in the number of new cases.
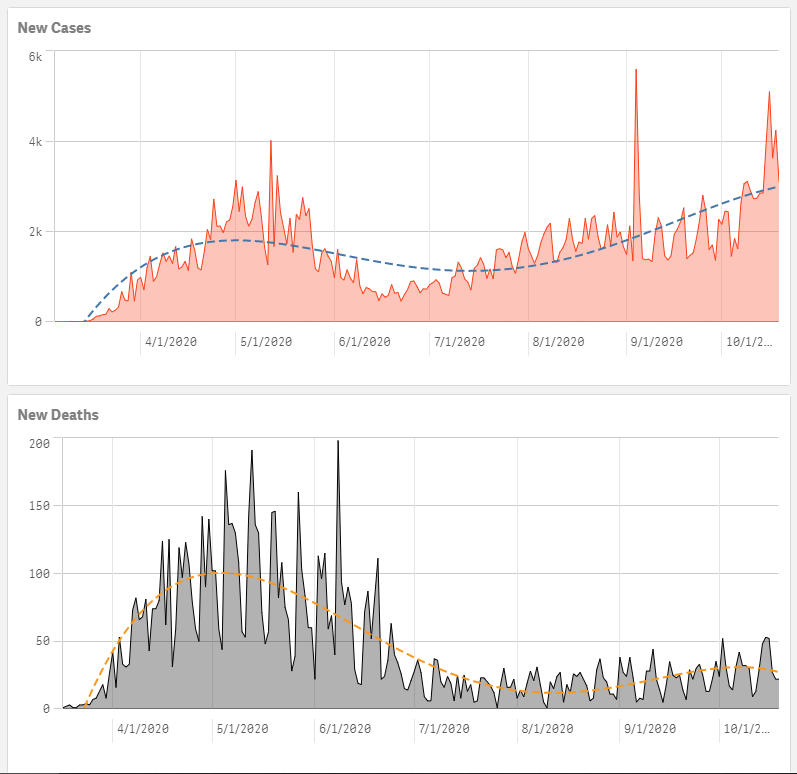
Although the number of new cases is increasing, we can have some solace in knowing that the number of deaths and hospitalizations are indeed declining in Illinois. What about the rest of the US?
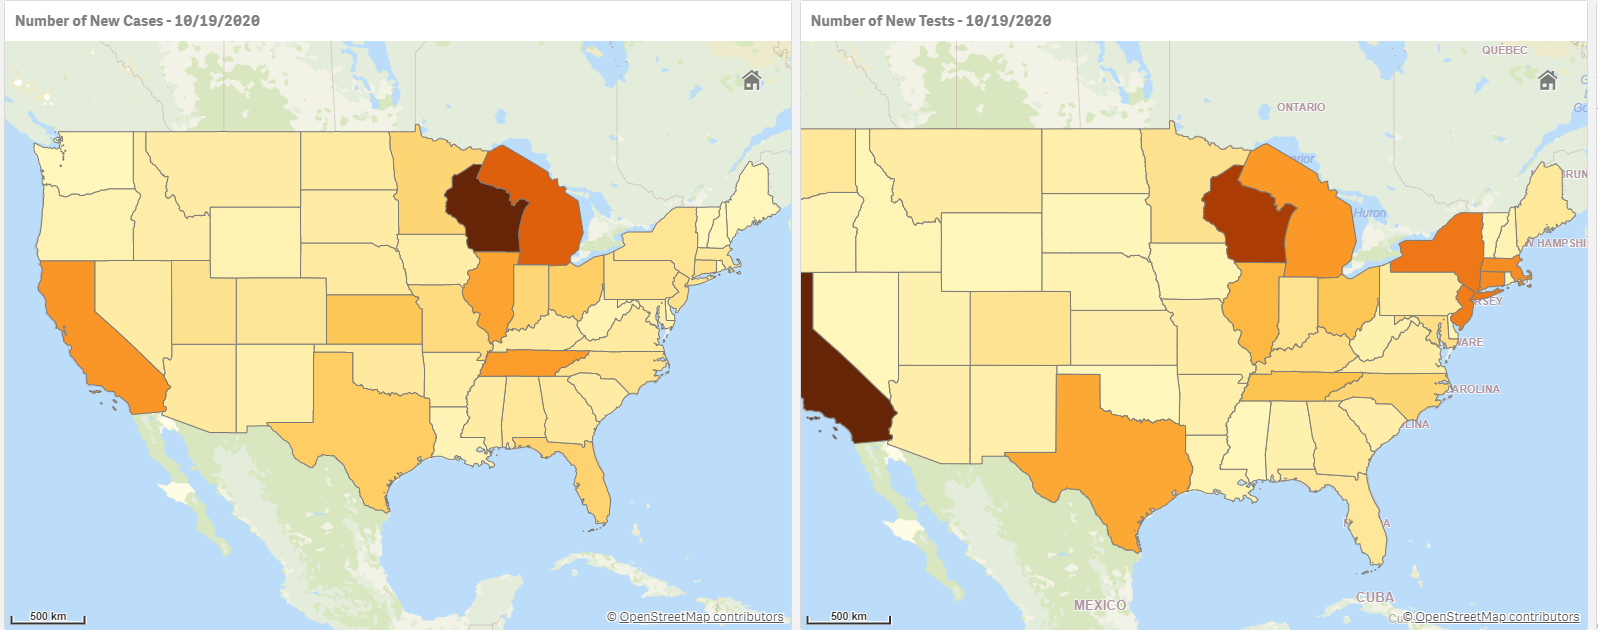
Looking at the map, we can see that the Midwest (Wisconsin and Michigan in particular) is witnessing a surge in the number of new cases in comparison to other regions. While the number of new tests is high in both Texas and the Upper Northeast area (including Boston, New York, etc.), the number of new positive cases is starting to settle down. Bravo to those areas that, according to the data, have learned to curb the spread of the virus.
By utilizing simple out of the box Qlik functionality, we are able to compile data from a multitude of sources and formats, create visualizations, apply trending, and formulate insights that allow us to tell a story to any audience. Now all we need is a vaccine!
For more information on this data or Qlik Sense, please contact a Pomerol Consultant today!

Owen is a consultant for Pomerol Partners out of the Chicago office. He is responsible for day-to-day client relations and development. Owen has principal experience with software implementations, data migration, modeling, UI design and configuration, and project management.
Owen graduated from Saint Louis University with a dual degree in Economics and Finance. He has ample experience in the BI space, both leading and aiding in the development and completion of various projects across multiple industries – procurement, finance, supply chain, pharmaceuticals, manufacturing, and healthcare.
Owen prides himself on his critical thinking skills and bridging the gap between the functional and technical aspects of a project to incorporate all components of the business for maximum efficiency.
Outside of work, Owen enjoys traveling, playing soccer, and cooking.
More Insights
-
Qlik to Power BI Migration

-
Client Product Reporting in FX Sales & Trading

-
Consolidating Financials for Multiple Acquisitions

-
How Machine Learning Can Transform the Financial Sector in 2024

-
Tracking Key Business Metrics using Power BI

-
Update on the future of Talend Open Studio

-
Multinational Bank’s Need of Fluid Understanding for their FX Pricing

-
Building a Single View of a Customer’s Portfolio to Support Regulatory Compliance

-
Exploring Change Data Capture (CDC)

-
🔍 Excel vs. BI Tools: Why It's Time to Evolve Your Data Strategy