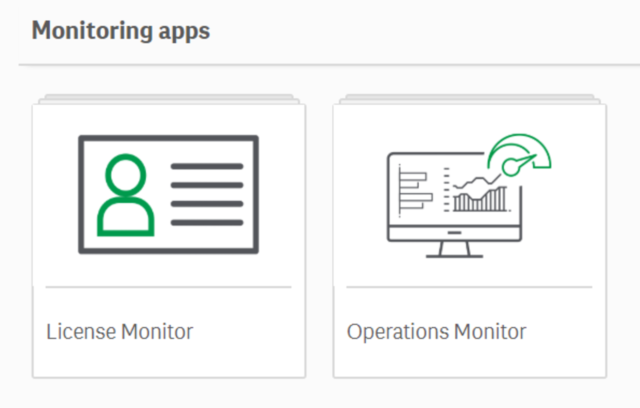
One of the first things I do at the beginning of the month is review the activity in the monitoring applications. We use Qlik everyday to analyze data that drives strategic decision making, so it only makes sense to take that same approach to understanding how Qlik is being utilized within our environment. In order to do this, we take a quick look at a few key elements of those monitoring tools.
For our clients that have NPrinting, we’ve developed a standard report that shows those key elements of the operations monitor and the license monitor for the past month. For those that don’t, we have created additional views in the monitoring applications to do the same.
First up is a quick glance at the engine CPU and engine RAM monitoring for the past month to be aware of any spikes to these two graphs. We can quickly investigate any significant or consistent spikes across the previous month leading us to important questions about our environment: Do we have a cluttered reload process? Is there a problematic app causing spikes in the CPU or RAM? Are there users causing issues with a private sheet?
The next item to consider is a review of the most active applications in the environment by tracking sessions in the last month. Usually, I split this out to look at the last 14 days, 21 days, month and 90 days. By analyzing this you can quickly spot any trends in the applications usage while also understanding which applications are getting the most attention in your environment. With this information, you find timely answers to important questions about how your applications are being utilized.
Understanding application usage can be furthered in more recent versions of Qlik Sense by analyzing sheet usage. Monitoring sheet activity can help you consolidate large apps if needed or begin an investigation into why sheets are being underutilized: Are those sheets delivering accurate results? Is more detail needed? Do users understand the visualization created?
We also want to review user session activity. By monitoring this you can quickly understand which users are utilizing their Qlik access and which are not. Understanding your most active users can identify internal champions to drive collaboration and more advanced development. Monitoring your inactive users can raise essential questions around how to drive engagement from allocated users who have no recent or very limited activity. Are these users getting the information they need? Is training required for the users to better understand their dashboards? Can these allocated licenses be put to better use elsewhere?
With the above considerations, we can leverage the monitoring tools to answer questions about our environment, but more importantly, we can leverage these tools to drive engagement of our users towards our most critical applications and get the most out of your Qlik environment.
More Insights
-
Qlik to Power BI Migration

-
Client Product Reporting in FX Sales & Trading

-
Consolidating Financials for Multiple Acquisitions

-
How Machine Learning Can Transform the Financial Sector in 2024

-
Tracking Key Business Metrics using Power BI

-
Update on the future of Talend Open Studio

-
Multinational Bank’s Need of Fluid Understanding for their FX Pricing

-
Building a Single View of a Customer’s Portfolio to Support Regulatory Compliance

-
Exploring Change Data Capture (CDC)

-
🔍 Excel vs. BI Tools: Why It's Time to Evolve Your Data Strategy

