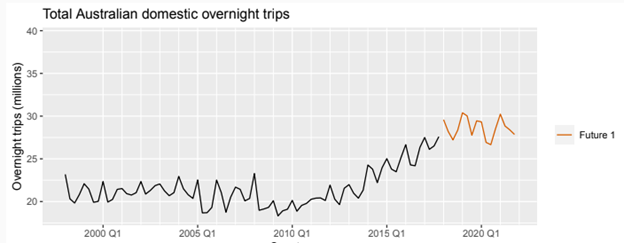
If you simulate the future, you may get a familiar-looking graph like this:
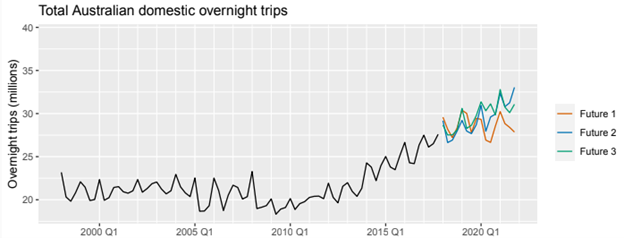
But what if we kept simulating the future? What other results could we expect to see? After all, like a parallel universe, one small change could lead to many other branching possibilities…
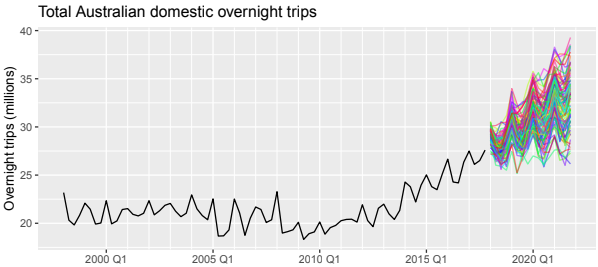
…and the possibilities can get chaotic very quickly
So how can we make sense of this? Well, with a statistical view of forecasts, we understand that there is a range of possibilities, but as the branches twist and overlap, some events stand out above the rest:
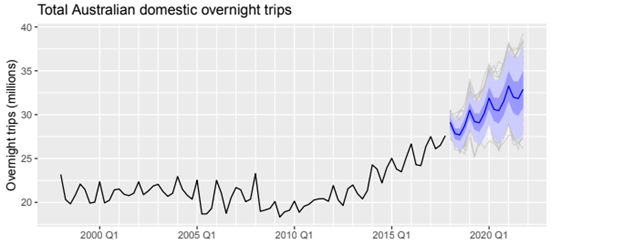
So really, a prediction is one representation of a range of possibilities (the middle), making a forecast your average parallel universe.
Did this change your perspective on what a forecast is? Do you/Are you considering using a forecast in your business? Please reach out!
More Insights
-
Consolidating Financials for Multiple Acquisitions

-
How Machine Learning Can Transform the Financial Sector in 2024

-
Pomerol Partners Enters Australian Market, Launching APAC Presence

-
Tracking Key Business Metrics using Power BI

-
Update on the future of Talend Open Studio

-
Multinational Bank’s Need of Fluid Understanding for their FX Pricing

-
Building a Single View of a Customer’s Portfolio to Support Regulatory Compliance

-
Exploring Change Data Capture (CDC)

-
🔍 Excel vs. BI Tools: Why It's Time to Evolve Your Data Strategy

-
Understanding the Basics of Data Analytics and its Crucial Role in Modern Businesses