Welcome to July 2021 Data DNA – Dataset Challenge!
Data DNA is your monthly learning and development appointment with yourself and hundreds of passionate data people. For free! Join us every month to work with a given data set and create better, more effective data visualizations, analysis and help us make information more accessible. The Data DNA community comes together every month from around the globe and we would love for YOU to become part of it, too.Win £50 Amazon Voucher!
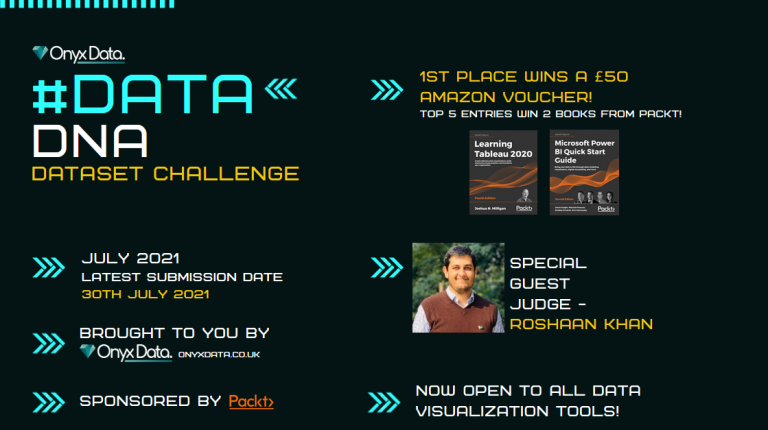
A winning entry will be chosen based on best visualization and successfully following the entry rules – winning a £50 Amazon voucher code!
The top 5 entries will also receive 2 data books from our sponsors Packt!
How to submit your entry:
- Follow Onyx Data on LinkedIn
- Share a LinkedIn post that contains both a direct @ mention to @Onyx Data, and the hashtag #dataDNA (it’s OK if you already follow Onyx Data)
- In your post, share an image of your visualization or dashboard (remember, it must be a single image)
- Tag, mention, and invite 5 connections to view your post or play along (optional)
Spotify Dataset
- This month we are analyzing the tracks of Spotify!
- Can we identify what makes a hit track?
Structure
Primary
- – id (Id of track generated by Spotify)
Numerical
- – acousticness (Ranges from 0 to 1)
- – danceability (Ranges from 0 to 1)
- – energy (Ranges from 0 to 1)
- – duration_ms (Integer typically ranging from 200k to 300k)
- – instrumentalness (Ranges from 0 to 1)
- – valence (Ranges from 0 to 1)
- – popularity (Ranges from 0 to 100)
- – tempo (Float typically ranging from 50 to 150)
- – liveness (Ranges from 0 to 1)
- – loudness (Float typically ranging from -60 to 0)
- – speechiness (Ranges from 0 to 1)
Dummy
- – mode (0 = Minor, 1 = Major)
- – explicit (0 = No explicit content, 1 = Explicit content)
Categorical
- – key (All keys on octave encoded as values ranging from 0 to 11, starting on C as 0, C# as 1 and so on…)
- – timesignature (The predicted timesignature, most typically 4)
- – artists (List of artists mentioned)
- – artists (Ids of mentioned artists)
- – release_date (Date of release mostly in yyyy-mm-dd format, however precision of date may vary)
- – name (Name of the song)
Data DNA – Dataset Challenge July – 2021 Winner
This month’s winning visualization is by – Salim Amarti
