A Forecast Is Your Average Parallel Universe
Four (4) Awesome Techniques for Leveling Up Your NPrinting Report
- -Ditch the manually scheduled app and NP trigger times by kicking off NPrinting tasks within Qlik
- -Collect metadata on your NPrinting environment using NPrinting APIs
- -Maintain your environment with email updates rather than waiting to find failures
- -Also leverage web-embedded API calls to let your SMEs approve report distributions
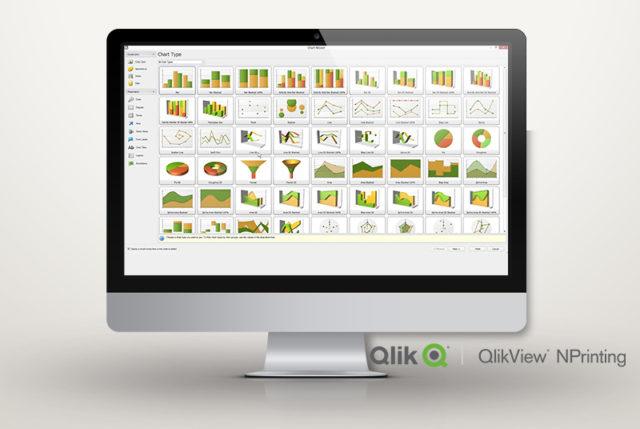
What is Qlik NPrinting?
For those of you unfamiliar with the tool, Qlik NPrinting allows an organization to create different content templates from their Qlik Environment and distribute them via email in a variety of formats including HTML, XLSX, PDF, DOC, and PPT. You develop the analytics inside a Qlik application and then create NPrinting reports from your apps to email and distribute to your users. The distribution tasks can be scheduled across regular intervals or utilizing exception-based reporting, to flag anomalies in your data as they surface. NPrinting lets you filter users, tasks, reports, and objects within reports based on dimension values in your application, so you’re able to send customized reports to different people, departments, etc. Matt, the U.S. rep, can receive the same report as Sally, the EMEA rep, but filtered on their respective geographical territory, while Larry, the head of sales, can receive an unfiltered version.
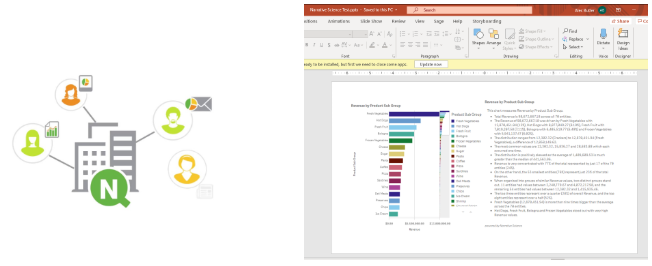
Here at Pomerol, we use NPrinting daily for both internal and external use-cases across several client environments. Our developers have seen first-hand the trials and errors of using the tool. Once set up correctly, it truly becomes a powerful product which can expand and automate your company’s reporting capabilities beyond just web content. Below are a few of the spoils of our toils that we wanted to share with you all and your BI teams.
1) NPrinting APIs
You may not know that NPrinting APIs even exist, or how to use them, so we’re hoping this post sheds some light on what is possible. There are several calls you can make that help you to understand your NPrinting environment, trigger various NPrinting operations, and manage your NPrinting deployment.

One way to use the NPrinting APIs is to create a Qlik application that can be used to pull together bits of information about your NPrinting environment. With the correct calls, we can pull in details on users, tasks, reports, connections, etc. This can make your developers’ lives a lot easier when trying to understand what apps are being connected to, who’s a user in NPrinting, what their roles are, what filters and groups are out there and more. This can reduce duplication of efforts and serve as a place where users can check to see which reports exist from which data sources in a visual manner without having to check each individual object in NPrinting.
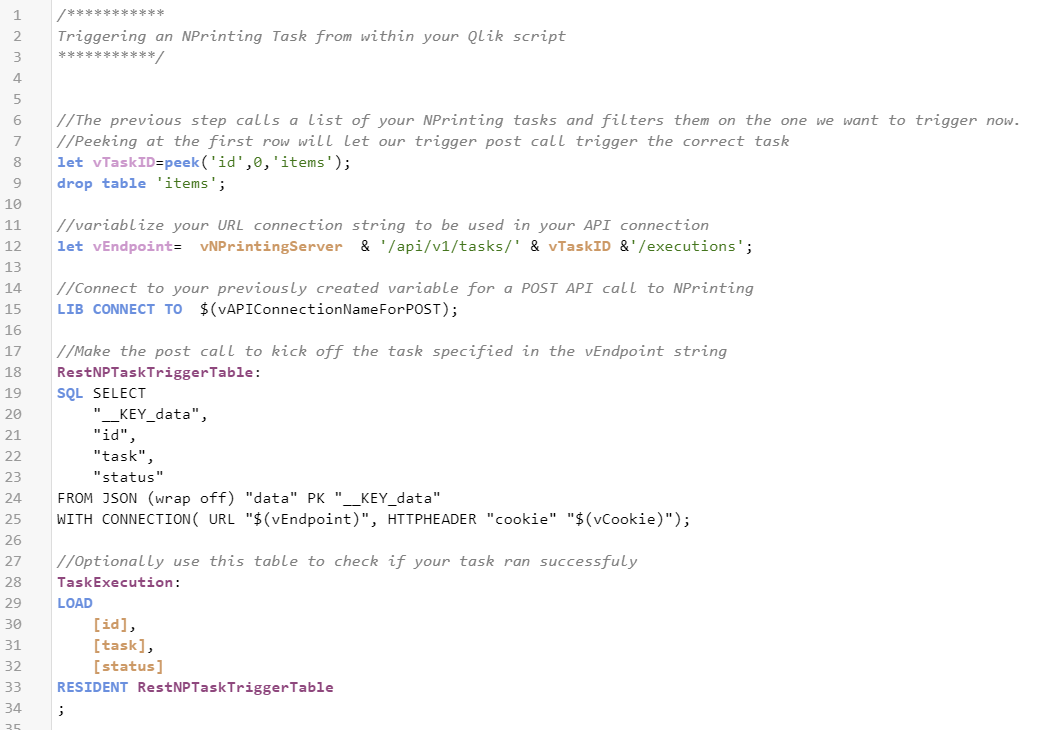
This next use-case is something that we deal with a lot, and it’s a great way to tap into the NPrinting APIs. Have you ever struggled with timing up your report distributions (through NPrinting or otherwise) with the scheduled reload of your application? We try to limit human assumptions as much as possible when engaging with our clients, and estimating how long you think the app reload will take and then setting your NPrinting task to execute when you think that reload will be complete is not a reliable practice that we’d recommend. This NPrinting API call lets you trigger a report distribution from within your Qlik script, eliminating the guessing game that can go very wrong if a report goes out to the business with old data in it. Mitigate this risk by automatically triggering your report as soon as the fresh data is loaded in.
2) How to use NPrinting to Monitor NPrinting?
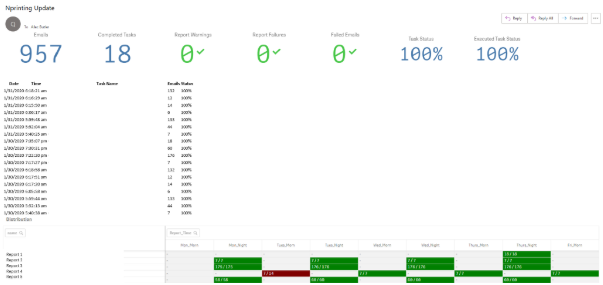
This title may sound weird, but nope, it’s a real use-case. You really can use NPrinting to monitor itself and update you on when your tasks are failing or if there is an error with your distributions. By giving Qlik Sense access to the Postgres tables that feed the NPrinting web console, you can create an application that reads the different tables and produces an output to catch errors, while explaining the distribution. It’s also handy for updating you on the status of NPrinting.
Most organizations set a scheduled distribution and either report in the morning or in the evening to their consumers. I schedule this email after those specified times, and if I don’t see this email, I know the services have had an issue and I can intervene before the users notice. This capability complements the new task error notifications well and allows us to have a 360 view of our distributions. We can see dynamic filtering and the changing environment at a high level and then connect to the app and dig into the details if necessary.
3) Future Use Case Ideas
Another way we could utilize the NPrinting APIs is for approvable distributions. We’ve seen cases where a BA or SME serves as the “gatekeeper” for a report, to ensure its accuracy before it is distributed out to a broader user base who may be making real-time operational decisions on this report. The way this process can be set up, is first to distribute the report exclusively to the SME, they will get an email with the report attached. They will review the report, and then click a link embedded in the email that will take them to a web page. This web page will contain a button that serves as the approval button for the SME. When they click this button, we can use the JavaScript encoded in the web page to call the NPrinting On-Demand Task Execution API and trigger the task that distributes the report to the entire user base.
5 Strategies for Creating a Powerful Data Department
Effective data teams will be tasked with creating a program that not only measures success but also inspires employees to take ownership of the outcomes.
Introduction
Data can be immensely powerful for companies looking to use technology to improve their performance, when used correctly. Data specialists can help your organization make more informed decisions with the information you have, improving its efficiency and helping you avoid pitfalls that could prove disastrous for your business. But data science is about much more than just providing recommendations – it’s about creating a culture of data-driven decision making throughout your organization. In this article, we’ll look at how you can use data to inform decisions in your company, why having a data-driven culture is important for success, and how to build one of these cultures at your firm or organization.
What are the benefits of a data-driven culture?
A data-driven culture is a culture where data is used to make decisions, to measure success and inspire employees. While it’s easy to see the benefits of a data-driven culture from an internal perspective, let’s take a look at how it can benefit your customers too:
Using data for decision making allows you to find patterns in customer behavior that would have been hidden otherwise. You’ll be able to understand what motivates them and what doesn’t. This will help you create better products or services that match their needs and aspirations more closely.
Measuring success shows customers they are valued by you because they provide useful information about themselves when they interact with your business or organization. A good example of this is LinkedIn encouraging users who have added connections or liked content on its site over time by showing them posts from those people above others in their news feed; this means its content has been valued highly enough by other users so as not only makes itself visible but also encourages engagement amongst friends/likes/pages which keeps them coming back again and again!
This helps companies highlight key metrics around user activity which helps improve future iterations of product offerings based upon user input.
How to build a data-driven culture
As the data-driven culture is more and more important, the role of the data consultant is becoming increasingly critical. Without a strong team of data scientists to support their business, companies are leaving themselves vulnerable to mistakes that could be easily avoided with the right tools in place.
The first step in building a strong team and building an effective culture is understanding why it’s so critical:
- Data drives decision making
- Data drives business strategy
- Data drives customer experience
Creating an environment where everyone understands the value of data and believes in its ability to drive decision making
To create a culture of data science, you need to teach people why data matters. You can do this by educating them about the importance of data in decision making. Emphasize how important it is to understand the context behind decisions and not rely solely on gut feelings.
You can also allow people to see how powerful your toolset is by showing them its capabilities through demos, workshops, and other interactive sessions. If you’re working with a smaller team that might not be able to attend these events (or if they aren’t available), make sure each member has access to all the resources they need online so they are able to keep up with their colleagues who are learning on-the-go.
Deciding on metrics
Once you’ve defined your goals and objectives, it’s time to identify the metrics that will help you achieve those goals. You want to make sure the metrics you choose are quantitative and measurable. In other words, they should be focused on outcomes rather than processes—for example: “We want to increase sales” versus “We want to increase inventory turnover.” They also need to be easy for everyone in your organization (not just data scientists) to understand; otherwise, they won’t have much value as a tool for communication or accountability. Furthermore, they must be easy for anyone in the company (including executives) who needs data-driven decision making tools at their fingertips—i.e., they need not require special training or knowledge of statistics in order for someone else within an organization’s hierarchy chain of command
How to use your metrics to make decisions
You’re probably familiar with metrics. They are a set of quantifiable numbers that provide useful information about your business. Metrics can help you understand what’s working, what isn’t, and how to fix it. You should definitely start using them!
That said, not all metrics are created equal; some are better than others at providing actionable insights into your business. Let’s take a look at two types of metrics that we recommend for data-driven decision making:
- Key performance indicators (KPIs) – KPIs show progress from the past few months or quarters toward a specific goal (for example, sales). They’re easy to access and track continuously throughout the year because they’re often delivered in charts or graphs on dashboards that display historical trends over time. Additionally, they’ve been well researched by both academics and professionals alike so we know which ones work best when used together within certain contexts (for example marketing vs customer service).
- Performance indicators – Performance indicators tell us how well we’re doing in specific areas but don’t give us much context as far as whether our efforts have been successful thus far—which makes them more difficult for decision makers since no actionable insights come from them unless there’s already been enough time invested into analyzing results first! However these can be very valuable when determining whether things need tweaking later down the line since many businesses tend towards perfectionism instead of experimentation (due largely because their “experiments” aren’t always considered successful before trying something else new again). These types include financial measures like ROI which show how much money was spent versus how much money was made during a given period/time frame etcetera.”
Where data is priority number one, the most important trait is trust
In any relationship, trust is an essential ingredient. It’s how people feel that you have their best interests at heart, and it’s what keeps them coming back for more. In a data-driven culture, trust is of the utmost importance—especially when your coworkers are all working on different projects and never actually meet face-to-face.
The key to building trust in this environment is transparency: if everyone knows what everyone else is doing, they can trust that everyone is working toward the same goals. For example: if one team member finds some new insight while conducting research on their own time, they should share it with the rest of their company so everyone can use it going forward (and maybe even incorporate it into their own work). Allowing employees this freedom creates a sense of ownership within each person’s role; they feel like they’re part of something bigger than themselves because they’re contributing toward something larger than themselves—which builds camaraderie among employees as well as brand loyalty among customers or clients who value such things!
Effective data teams will be tasked with creating a program that not only measures success but also inspires employees to take ownership of the outcomes.
To ensure that your data program is successful, you must also create a culture of data-driven decision making. This means that employees should be able to use data to make decisions and not just rely on the opinions of their managers or personal experience. It’s also important for your team members to understand how their work impacts the overall goals of the company.
When it comes to measuring success, effective teams will set goals and create programs with actionable metrics in mind. For example, if you have an email marketing campaign that you want people to sign up for (which would then lead them into becoming customers), then it would be important for your team members to know what percentage of recipients actually sign up after receiving an email from you instead of just sending emails blindly hoping something good happens.
Conclusion
To effectively create a data-driven culture, you must ensure that everyone understands and believes in the value of data. Trust should be at the core of your organization – if it is not present then you cannot hope to successfully implement a data program with success. Companies need to decide how they will use their metrics in order to make decisions about future actions – but always remember that these decisions should still be based on gut instincts as well as data analysis. Just like any other tool, there are limitations to what information can tell us about our world around us so never stop thinking for yourself!
Smart Chicken’s Inspiring Success: Leading the Way in BI and Analytics
Tecumseh Poultry was founded in 1998 based on a simple goal, “to produce the best fresh chicken in the United States”, and that’s what they do! Over 20 years they have defined and then implemented methods which result in the highest quality finished products. In other words, they do things the right way. Not necessarily the easiest, fastest or most efficient way. Simply the right way.
So, what exactly does this mean? Proper treatment and care of their chickens and people, and the utmost care and discretion in how they process and package their product. Furthermore, they do all this while keeping a careful eye on the environment and on the sustainability and renewability of the resources they rely on.
Beyond being industry innovators in their day to day operations, they’re also 10 steps ahead when it comes to how they analyze their business and are visionary in how they use data to identify opportunity for improvement. In fact, Smart Chicken has more advanced predictive analytics than many investment banks we’ve worked with. Recognizing this vision early on, Pomerol was very excited to be given the opportunity to help Smart Chicken take their BI and analytics to the next level.
“Smart Chicken has more advanced predictive analytics than many investment banks”
No shortage of business challenges….
There are many challenges unique to producing a perishable fresh product. The shelf life is short, high wastage would make the business model unfeasible, and there’s no real opportunity for inventory. So, supply and demand need to be in sync, and this requires precision planning and a perfect understanding of your market. Supply is relatively fixed in the short term, but demand can fluctuate wildly depending on time of year, weather and promotional activities. Believe it or not, demand for white breast meat skyrockets for the short period of time that our new year’s resolutions are still intact, before settling back down in February. Try planning around that!
Beyond this, there are a raft of challenges unique to poultry production. Football season sees a huge uptick in wings consumption, but last time we checked, a chicken only has two wings, so there’s no ability to increase production of this single SKU. In another twist, Thanksgiving and Christmas is a time of year where we all get together and eat whole Turkey, but that sees the demand for whole chickens plummet for November and December. Planning around these erratic peaks and troughs causes plenty of pain, but together with the Smart Chicken team we’ve developed some novel ways of optimizing the planning process through a combination of live analytics in Qlik dashboards, and machine learning assisted forecasting with Data Robot.
Using Qlik to shed light on the business
The power of Qlik is leveraged for both its ETL capabilities and as a data visualization and reporting platform. Powerful associative models consolidate data from ERP, CRM, live production and planning tools giving managers an asset to empower decision making.
The customer demand forecasting process is a critical step in the chain to running a successful operation. Visualizing the forecast in Qlik, managers can quickly move from a brand level right down to individual SKUs. Different ordering patterns unique to geographies are easy to see, and the demand fluctuations driven by weather, events, promotions and holidays are all evident when trended or exposed through geographic maps.
Qlik provides a great view into the forecasting and sales data, but with such diverse ordering patterns there’s real opportunity in perfecting the forecasting process right down to the SKU and customer level. Smart Chicken and Pomerol enlisted the help of Data Robot to apply Automated Machine Learning technology to the demand forecasting process.
Taking forecasting to the next level with Data Robot and Automated Machine Learning
What really separates Smart Chicken apart from their competitors is how tight their forecasting and planning process is. Representatives in the field have their finger on the pulse by chatting to customers in supermarkets and they feed anecdotal information back into the planning team, while back at head office demand is forecast right down to the SKU and customer level, something most companies would not dare attempt.
Instead of applying a single forecasting algorithm across all customers and SKUs, Data Robot has enabled Smart Chicken to mathematically cluster and segment similar customers and products based on volume and ordering behaviors. Unique forecasting models are then auto-generated for each unique cluster.
Pulling from a library of hundreds of predictive models, Data Robot ranks its recommended models based on performance, error and speed, and then recommends a model to be put into production. Without an in-house data science team, Smart Chicken uses the power of automated machine learning and predictive analytics to further refine customer demand forecasting.
Beyond demand forecasting
While customer demand is a pivotal data point for Smart Chicken, there are other parts of the business that can also benefit from the power of Data Robot. Predicting the growth trajectory and final weight of chickens can inform the planning process of anticipated supply. In a sector where inventory is almost non-existent, having a keen eye on supply avoids surprises and lets the customer support team know exactly how much produce they have available to distribute. Having advance notice of any expected shortfalls lets customer service pro-actively manage expectations.
In another industry first, Smart Chicken have installed a full end-to-end ‘air chill’ system – the only one of its kind in the US. While the impact this has on product quality is beyond measure, it’s a tricky piece of equipment to run and presents a risk should it fail. Smart Chicken are looking to Data Robot for predictive maintenance. By analyzing the events leading up to previous parts failures, we can begin to predict when another failure is looking likely. IOT sensors constantly measure conveyor belt motor amperage, temperature and tension. The most minute change in tension may indicate a stressed or worn ball-bearing, or a slight increase in motor temperature might indicate an increased level of strain. Being able to pro-actively identify issues before they fail during production hours can have a massive impact on continuity of supply.
Looking to the future
As consumers place a higher importance on the quality and origin of their produce, the market for Smart Chicken’s products is on the rise. The game-changing innovator from small-town Nebraska is setting the bar for the larger producers. We’re excited to be on the analytics journey with them!
Visit the Smart Chicken website: https://www.smartchicken.com