How to Build a Modern Data Warehouse
Unlock Clear NetSuite Insights with Pomerol’s Qlik NetSuite Accelerator for Retail Sales
Data & Analytics Glossary
Four (4) Awesome Techniques for Leveling Up Your NPrinting Report
- -Ditch the manually scheduled app and NP trigger times by kicking off NPrinting tasks within Qlik
- -Collect metadata on your NPrinting environment using NPrinting APIs
- -Maintain your environment with email updates rather than waiting to find failures
- -Also leverage web-embedded API calls to let your SMEs approve report distributions
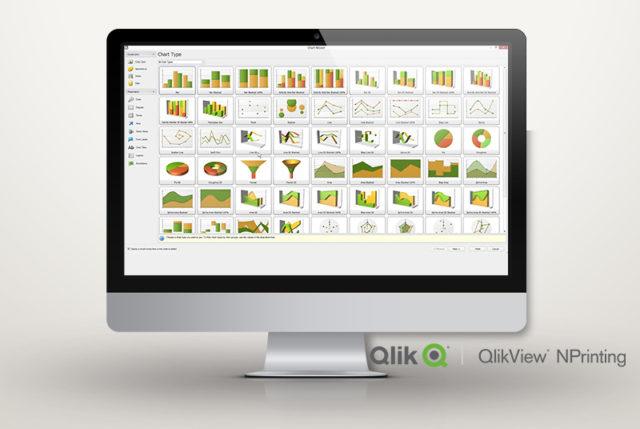
What is Qlik NPrinting?
For those of you unfamiliar with the tool, Qlik NPrinting allows an organization to create different content templates from their Qlik Environment and distribute them via email in a variety of formats including HTML, XLSX, PDF, DOC, and PPT. You develop the analytics inside a Qlik application and then create NPrinting reports from your apps to email and distribute to your users. The distribution tasks can be scheduled across regular intervals or utilizing exception-based reporting, to flag anomalies in your data as they surface. NPrinting lets you filter users, tasks, reports, and objects within reports based on dimension values in your application, so you’re able to send customized reports to different people, departments, etc. Matt, the U.S. rep, can receive the same report as Sally, the EMEA rep, but filtered on their respective geographical territory, while Larry, the head of sales, can receive an unfiltered version.
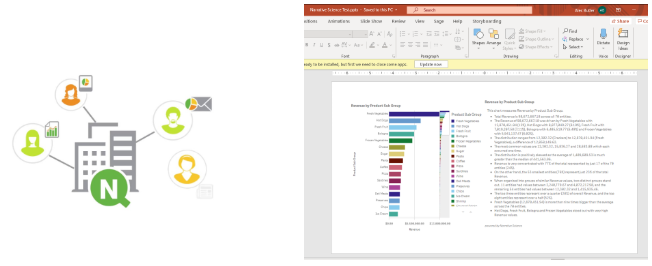
Here at Pomerol, we use NPrinting daily for both internal and external use-cases across several client environments. Our developers have seen first-hand the trials and errors of using the tool. Once set up correctly, it truly becomes a powerful product which can expand and automate your company’s reporting capabilities beyond just web content. Below are a few of the spoils of our toils that we wanted to share with you all and your BI teams.
1) NPrinting APIs
You may not know that NPrinting APIs even exist, or how to use them, so we’re hoping this post sheds some light on what is possible. There are several calls you can make that help you to understand your NPrinting environment, trigger various NPrinting operations, and manage your NPrinting deployment.
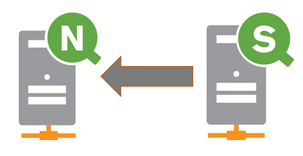
One way to use the NPrinting APIs is to create a Qlik application that can be used to pull together bits of information about your NPrinting environment. With the correct calls, we can pull in details on users, tasks, reports, connections, etc. This can make your developers’ lives a lot easier when trying to understand what apps are being connected to, who’s a user in NPrinting, what their roles are, what filters and groups are out there and more. This can reduce duplication of efforts and serve as a place where users can check to see which reports exist from which data sources in a visual manner without having to check each individual object in NPrinting.
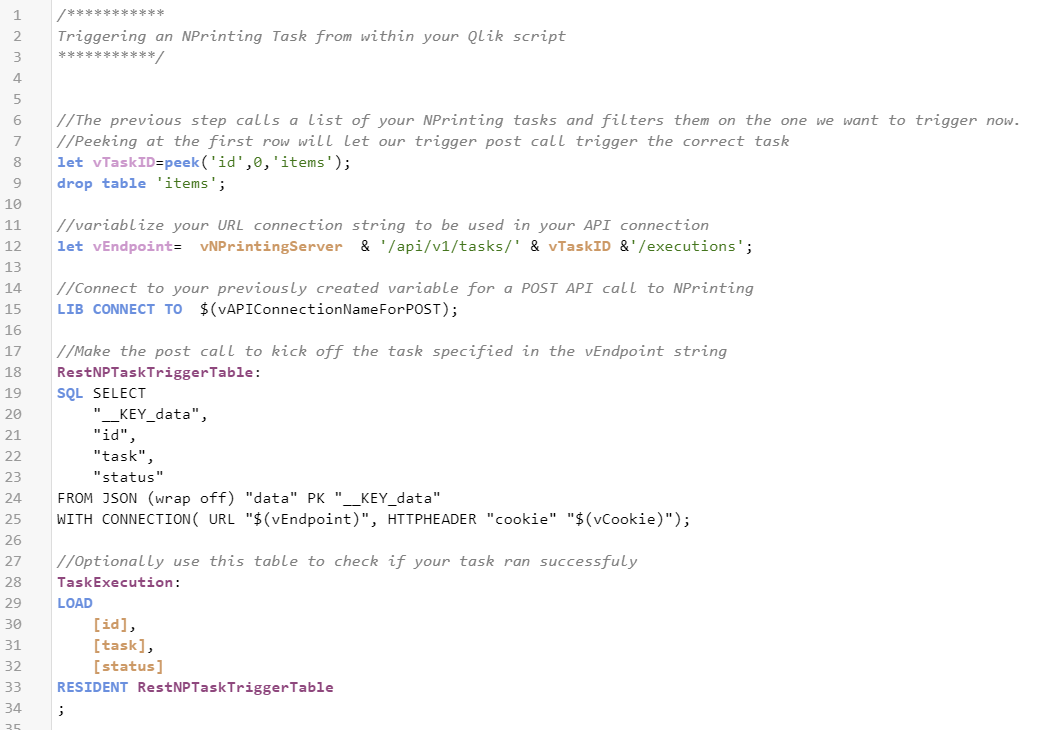
This next use-case is something that we deal with a lot, and it’s a great way to tap into the NPrinting APIs. Have you ever struggled with timing up your report distributions (through NPrinting or otherwise) with the scheduled reload of your application? We try to limit human assumptions as much as possible when engaging with our clients, and estimating how long you think the app reload will take and then setting your NPrinting task to execute when you think that reload will be complete is not a reliable practice that we’d recommend. This NPrinting API call lets you trigger a report distribution from within your Qlik script, eliminating the guessing game that can go very wrong if a report goes out to the business with old data in it. Mitigate this risk by automatically triggering your report as soon as the fresh data is loaded in.
2) How to use NPrinting to Monitor NPrinting?
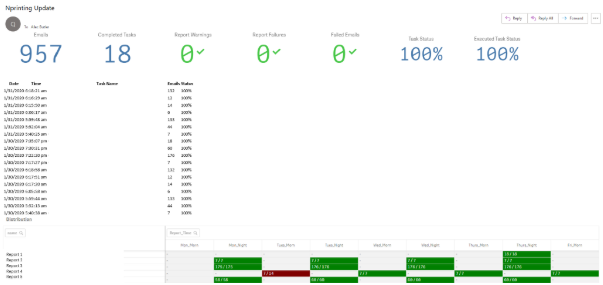
This title may sound weird, but nope, it’s a real use-case. You really can use NPrinting to monitor itself and update you on when your tasks are failing or if there is an error with your distributions. By giving Qlik Sense access to the Postgres tables that feed the NPrinting web console, you can create an application that reads the different tables and produces an output to catch errors, while explaining the distribution. It’s also handy for updating you on the status of NPrinting.
Most organizations set a scheduled distribution and either report in the morning or in the evening to their consumers. I schedule this email after those specified times, and if I don’t see this email, I know the services have had an issue and I can intervene before the users notice. This capability complements the new task error notifications well and allows us to have a 360 view of our distributions. We can see dynamic filtering and the changing environment at a high level and then connect to the app and dig into the details if necessary.
3) Future Use Case Ideas
Another way we could utilize the NPrinting APIs is for approvable distributions. We’ve seen cases where a BA or SME serves as the “gatekeeper” for a report, to ensure its accuracy before it is distributed out to a broader user base who may be making real-time operational decisions on this report. The way this process can be set up, is first to distribute the report exclusively to the SME, they will get an email with the report attached. They will review the report, and then click a link embedded in the email that will take them to a web page. This web page will contain a button that serves as the approval button for the SME. When they click this button, we can use the JavaScript encoded in the web page to call the NPrinting On-Demand Task Execution API and trigger the task that distributes the report to the entire user base.
Are you getting the most out of your Qlik Sense monitoring tools?
One of the first things I do at the beginning of the month is review the activity in the monitoring applications. We use Qlik everyday to analyze data that drives strategic decision making, so it only makes sense to take that same approach to understanding how Qlik is being utilized within our environment. In order to do this, we take a quick look at a few key elements of those monitoring tools.
For our clients that have NPrinting, we’ve developed a standard report that shows those key elements of the operations monitor and the license monitor for the past month. For those that don’t, we have created additional views in the monitoring applications to do the same.
First up is a quick glance at the engine CPU and engine RAM monitoring for the past month to be aware of any spikes to these two graphs. We can quickly investigate any significant or consistent spikes across the previous month leading us to important questions about our environment: Do we have a cluttered reload process? Is there a problematic app causing spikes in the CPU or RAM? Are there users causing issues with a private sheet?
The next item to consider is a review of the most active applications in the environment by tracking sessions in the last month. Usually, I split this out to look at the last 14 days, 21 days, month and 90 days. By analyzing this you can quickly spot any trends in the applications usage while also understanding which applications are getting the most attention in your environment. With this information, you find timely answers to important questions about how your applications are being utilized.
Understanding application usage can be furthered in more recent versions of Qlik Sense by analyzing sheet usage. Monitoring sheet activity can help you consolidate large apps if needed or begin an investigation into why sheets are being underutilized: Are those sheets delivering accurate results? Is more detail needed? Do users understand the visualization created?
We also want to review user session activity. By monitoring this you can quickly understand which users are utilizing their Qlik access and which are not. Understanding your most active users can identify internal champions to drive collaboration and more advanced development. Monitoring your inactive users can raise essential questions around how to drive engagement from allocated users who have no recent or very limited activity. Are these users getting the information they need? Is training required for the users to better understand their dashboards? Can these allocated licenses be put to better use elsewhere?
With the above considerations, we can leverage the monitoring tools to answer questions about our environment, but more importantly, we can leverage these tools to drive engagement of our users towards our most critical applications and get the most out of your Qlik environment.
Tech Solutions: How Creativity Solves Problems in Crisis Situations
Over the weekend there was a fire at my neighbor’s house. I had just fired up our grill and put some brats on. I looked out the window and saw tons of smoke and thought dinner was ruined. As soon as I opened the door I realized, “That’s not brat smoke!” My wife and I ran outside to figure out where the fire was. She spotted the flames across the street. We knew we needed to let the neighbors know to get out of the building. The way our houses are setup we face the garages of the row of townhouses across the street. Their kitchen windows are directly above the garage. We ran back and forth screaming “FIRE!” but it was like nobody heard us. What a horrible time for my phone to be on the charger inside with a dead battery.
As I screamed like a madman, my wife tried to open a car to use the horn to attract attention. No dice; The car was locked. Finally she said, “I’m going to run around the front and knock and ring doorbells.” The neighbor whose house was on fire finally saw me as did a few other neighbors. Some didn’t hear me at all, they only found out when my wife rang their doorbell. Another neighbor called 911 and within a few minutes – that seemed like an eternity – there were 6 fire trucks and about 30 firefighters on the scene.
Another interesting part of the story… in that row of townhouses one of the units has a hose on the roof for watering plants. Unfortunately the hose was just a little bit too short to reach the flames. So the neighbor (who is actually a firefighter for the City of Chicago) and his wife filled small garbage cans with water and he ran back and forth trying to knock the fire down. Don’t try this at home…
My point in all of this: The first attempt at solving a problem might not always work. In my experience most hard problems aren’t solved with the first approach. You have to be willing to get creative and try new things. whether it’s new technologies, new features or new functions. The first step is taking a step back and evaluating your results. If my wife hadn’t stopped and thought about it we would have spent even more time screaming and may have never achieved our goal of getting people out.
The neighbors sustained some damage to the top deck and loft. All-in-all, it was a lot better than we thought it was going to be. The firefighter’s wastebaskets didn’t fare as well… two of them slipped out of his hands as he was launching water onto the fire. He found them melted to what was left of the deck.
When was the last time you looked at your approach to evaluate your results? When was the last time you tried a new approach? When was the last time you got input or new ideas from someone else? When was the last time you acted like the world was on fire and you had to take action?
Business Intelligence Dashboards and Tinder
Answer: First impressions last!
Heading off on a Tinder date, you’d be wise to style your hair, wear something smart, and think about what you want to say. Why? Because first impressions last. They can be make or break, and haunt you if you get it wrong. The same applies to building business intelligence dashboards – they need to look sharp, tell a good story, and be a joy to be around.
A typical BI application may consist of many dashboards or reports, but it’s the landing page where you set the scene, and send the user off on their journey. If you get this piece wrong your user risks being disorientated, and wandering without much direction.
Build a Qlik landing page that hits the spot. Here are the 4 key business questions I want answered on a BI landing page – along with the intended outcome.
#1.
Business Question: What happened? (focus your KPIs on the most recent/relevant period)
Intended Outcome: I know where we stand on key metrics that we use to asses the health of our business.
#2.
Business Question: How did we get here? (show trending up to today)
Intended Outcome: I know if we’re on the way up, the way down, or if this trend is cyclical/seasonal/repetitive etc.
#3.
Business Question: How are we performing against our benchmarks? (could be targets, budget, forecast, prior periods, industry benchmarks etc.)
Intended Outcome: I know if we’re we’re performing well or poorly, if we’re under or over based on the benchmark that matters (the most important/relevant benchmark will always differ from company to company, industry to industry, but remember ‘performance’ is always a relative measure).
#4.
Business Question: What are the key drivers of this trend/movement/performance (which product category, which sales territory, which week etc.)
Intended Outcome: I know what to go and investigate – I have some direction and purpose as I continue to navigate through the application.
If you can tackle these 4 business questions on your landing page your users will love you for it, and hey……you might even get a second date!
Data Analytics 101: Business Basics for Success
Understanding the Basics of Data Analytics and its Crucial Role in Modern Businesses
In the simplest terms, Data Analytics is the process of examining, cleaning, transforming, and modeling data to discover useful information, inform conclusions, and aid decision-making. It’s like turning on the lights in a dark room and suddenly seeing everything clearly!
Data Analytics isn’t just one monolithic entity, but a collection of different types:
1. Descriptive Analytics: What happened? It looks at past data to understand what has occurred.
2. Diagnostic Analytics: Why did it happen? This aims to determine the cause of a past event.
3. Predictive Analytics: What could happen? This uses historical data to predict future outcomes.
4. Prescriptive Analytics: What should we do? It suggests actions to take for optimal outcomes.
But why is Data Analytics so crucial in today’s business world?
In the digital age, businesses generate and have access to massive amounts of data. Data analytics allows businesses to make sense of this data, turning raw information into valuable insights. It enables improved decision-making, provides a better understanding of customer behavior, identifies trends, and even helps predict future outcomes.
The power of Data Analytics isn’t just in providing information; it’s in the actionable insights that can drive business strategy, identify new opportunities, and foster innovation.
No matter the size or industry of your business, leveraging data analytics can lead to significant competitive advantages. By making data-driven decisions, we can ensure more efficient operations and improved customer satisfaction – the cornerstones of a successful business!
Stay tuned for more insights as we delve deeper into this fascinating world.
Remember, “Without data, you’re just another person with an opinion.” – W. Edwards Deming
Expert Data Analytics Consultants: 6 Persuasive Reasons to Use Them
In this fast paced environment and quickly changing market and business needs, it is beneficial to utilize a smart work strategy than a hard work approach.
With the onset of data sciences, data analytics and concept of big data, the importance of data has increased especially in context of establishing and optimizing business models, processes and so on. Today Data Analytics play a significant role in success of any business of any kind.
The benefits of data analytics are endless: You get meaningful insights from data, key indicators for measuring the success of your business model and useful future predictors. However, as astonishing as it may sound, data analytics is quite technical and requires consultation from experts of the field. At Pomerol Partners, a global consultancy firm, we help you to pinpoint your problematic areas, focus on your strengths, cut down costs and so much more.
Let’s discuss why should you hire a consultancy firm for data analytics projects.
1. Smart Work instead of Hard Work:
In this fast paced environment and quickly changing market and business needs, it is beneficial to utilize a smart work strategy than a hard work approach. Pomerol Partners will help you to directly focus on your goal with its expertise that will not only save you from unnecessary headaches but will also cut your operational costs and you will directly hit the bull’s eye.
2. Specific BI tools will assist you in taking Informed Decisions:
If you are involved in decision making process of a company, then you have most likely faced the uncertainty about making a decision based on enormous amounts of information and data. At Pomerol Partners, with the assistance of our wide array of BI tools, we help you to orient your decision making process by guiding you about the bigger picture of the data and how each fragment of data is unique in itself and contribute to bigger picture. With the help of tools such as Power BI dashboards, to name one, you can make quick and informed decisions based on how each element of data is relevant and significant in overall picture. We strive to equip you with the right tools to make the best decisions for your business.
3. Better Customer and Niche Targeting:
A targeted approach is a must have now days. With smart data analytics approach, carefully curated by experts of Pomerol Partners, a global consultancy firm, you can identify your potential customer base and what kind of strategies you need for advertising or decision making and so on. In a nutshell, data guides you to make smart decisions and ultimately determines the fate of your business as well.
4. Mindful Spending and Cutting down unnecessary Costs:
The success of any business or project lies in the heart of “spending at right place and in right amount”. With expert opinions of consultants and our visualisation tools, you can identify the areas where you can spend least amount and get maximum benefit out of it. Furthermore, you can also pinpoint those areas where you are spending unnecessary finances thereby cutting down business costs and optimizing the overall performance of your project.
5. Helps you to Innovate your Business Processes:
Data Insights is key to guiding the course of business towards successful decisions and a Data Analytics Consultancy firm will help you in getting meaningful insights from the data and thereby putting your business on the right track. Other than that, with the large volumes of data and meaning full insights, a global consultancy firm, will also assist you in overhauling your project shortcomings and innovations to build your project according to current market dynamics, no matter your location.
6. Guide your Marketing Strategies:
The world is currently witnessing a digital revolution and the content and graphics of marketing play an imperative role in the success or failure of any marketing campaign. With the right expertise of Data Analytics Consultancy firm, you’ll be able to pinpoint your customer base, what kind of marketing strategies will intrigue them towards your business and it will ultimately lead you to curate an effective campaign in minimum cost.
Summary:
To sum it up, words fell short of describing the importance of Data Analytics and the role it plays in determining the success of your business or projects. Undoubtedly, data speaks volumes now days and hiring the services of a right Data Analytics Consultancy Firm will make your business to succeed by leaps and bounds. The expert and professional advice of a Consultancy firm will smooth your decision making process and saves you from lots of troubles of data interpreting and analyzing. With the help of our innovative and out of the box solutions, you can analyze the importance of each data element while taking a business decision with the effort of just few clicks. To reiterate it, this is era of smart and dedicated approach rather than conventional business approaches.
Smart Chicken’s Inspiring Success: Leading the Way in BI and Analytics
Tecumseh Poultry was founded in 1998 based on a simple goal, “to produce the best fresh chicken in the United States”, and that’s what they do! Over 20 years they have defined and then implemented methods which result in the highest quality finished products. In other words, they do things the right way. Not necessarily the easiest, fastest or most efficient way. Simply the right way.
So, what exactly does this mean? Proper treatment and care of their chickens and people, and the utmost care and discretion in how they process and package their product. Furthermore, they do all this while keeping a careful eye on the environment and on the sustainability and renewability of the resources they rely on.
Beyond being industry innovators in their day to day operations, they’re also 10 steps ahead when it comes to how they analyze their business and are visionary in how they use data to identify opportunity for improvement. In fact, Smart Chicken has more advanced predictive analytics than many investment banks we’ve worked with. Recognizing this vision early on, Pomerol was very excited to be given the opportunity to help Smart Chicken take their BI and analytics to the next level.
“Smart Chicken has more advanced predictive analytics than many investment banks”
No shortage of business challenges….
There are many challenges unique to producing a perishable fresh product. The shelf life is short, high wastage would make the business model unfeasible, and there’s no real opportunity for inventory. So, supply and demand need to be in sync, and this requires precision planning and a perfect understanding of your market. Supply is relatively fixed in the short term, but demand can fluctuate wildly depending on time of year, weather and promotional activities. Believe it or not, demand for white breast meat skyrockets for the short period of time that our new year’s resolutions are still intact, before settling back down in February. Try planning around that!
Beyond this, there are a raft of challenges unique to poultry production. Football season sees a huge uptick in wings consumption, but last time we checked, a chicken only has two wings, so there’s no ability to increase production of this single SKU. In another twist, Thanksgiving and Christmas is a time of year where we all get together and eat whole Turkey, but that sees the demand for whole chickens plummet for November and December. Planning around these erratic peaks and troughs causes plenty of pain, but together with the Smart Chicken team we’ve developed some novel ways of optimizing the planning process through a combination of live analytics in Qlik dashboards, and machine learning assisted forecasting with Data Robot.
Using Qlik to shed light on the business
The power of Qlik is leveraged for both its ETL capabilities and as a data visualization and reporting platform. Powerful associative models consolidate data from ERP, CRM, live production and planning tools giving managers an asset to empower decision making.
The customer demand forecasting process is a critical step in the chain to running a successful operation. Visualizing the forecast in Qlik, managers can quickly move from a brand level right down to individual SKUs. Different ordering patterns unique to geographies are easy to see, and the demand fluctuations driven by weather, events, promotions and holidays are all evident when trended or exposed through geographic maps.
Qlik provides a great view into the forecasting and sales data, but with such diverse ordering patterns there’s real opportunity in perfecting the forecasting process right down to the SKU and customer level. Smart Chicken and Pomerol enlisted the help of Data Robot to apply Automated Machine Learning technology to the demand forecasting process.
Taking forecasting to the next level with Data Robot and Automated Machine Learning
What really separates Smart Chicken apart from their competitors is how tight their forecasting and planning process is. Representatives in the field have their finger on the pulse by chatting to customers in supermarkets and they feed anecdotal information back into the planning team, while back at head office demand is forecast right down to the SKU and customer level, something most companies would not dare attempt.
Instead of applying a single forecasting algorithm across all customers and SKUs, Data Robot has enabled Smart Chicken to mathematically cluster and segment similar customers and products based on volume and ordering behaviors. Unique forecasting models are then auto-generated for each unique cluster.
Pulling from a library of hundreds of predictive models, Data Robot ranks its recommended models based on performance, error and speed, and then recommends a model to be put into production. Without an in-house data science team, Smart Chicken uses the power of automated machine learning and predictive analytics to further refine customer demand forecasting.
Beyond demand forecasting
While customer demand is a pivotal data point for Smart Chicken, there are other parts of the business that can also benefit from the power of Data Robot. Predicting the growth trajectory and final weight of chickens can inform the planning process of anticipated supply. In a sector where inventory is almost non-existent, having a keen eye on supply avoids surprises and lets the customer support team know exactly how much produce they have available to distribute. Having advance notice of any expected shortfalls lets customer service pro-actively manage expectations.
In another industry first, Smart Chicken have installed a full end-to-end ‘air chill’ system – the only one of its kind in the US. While the impact this has on product quality is beyond measure, it’s a tricky piece of equipment to run and presents a risk should it fail. Smart Chicken are looking to Data Robot for predictive maintenance. By analyzing the events leading up to previous parts failures, we can begin to predict when another failure is looking likely. IOT sensors constantly measure conveyor belt motor amperage, temperature and tension. The most minute change in tension may indicate a stressed or worn ball-bearing, or a slight increase in motor temperature might indicate an increased level of strain. Being able to pro-actively identify issues before they fail during production hours can have a massive impact on continuity of supply.
Looking to the future
As consumers place a higher importance on the quality and origin of their produce, the market for Smart Chicken’s products is on the rise. The game-changing innovator from small-town Nebraska is setting the bar for the larger producers. We’re excited to be on the analytics journey with them!
Visit the Smart Chicken website: https://www.smartchicken.com
Transforming Pharmaceutical Sales with Data Visualization
Data Analytics in Hospitality
Transforming Airport Operations with Advanced Data Warehousing
Pricing Intelligence in Banking
Rehypothecation Gap Analysis
Industrial Supply Chain & Procurement
Customer Insight and Marketing Effectiveness
Efficient Data for Shotshell Reloader Production
Building a Data Management & Analytics Strategy
Power Maximizing Snowflake Performance for BI Products

The business world is rushing as technology and innovation enter different areas. Any organization that wants to remain competitive and stand out to customers must make real-time decisions. Of course, these decisions must be supported by the judgment of business experts and backed by data.
If our experts and managers can access relevant and up-to-date information using a data strategy, it can yield incredible results for growing the business. This is where business intelligence has its first impact, managing to describe the causes and results of current actions, as well as providing options to take different paths in the near future. It considers historical data while making predictions or simply analyzing trends.
Every data strategy, from a technical perspective, involves different components, starting with the sources of information and the ingestion of these data from transactional systems into a data repository or data warehouse with analytical features. Once the data is stored in the data warehouse, the data cleansing, transformation, and enrichment processes come. Then, it is followed by correct data modeling so final users can use their visualization tools to display dashboards with strategic information, KPIs, and trends. That provides inputs to decision-making. Data governance processes and business objectives must accompany all these technical elements. If one part does not complement the other, the data strategy would be incomplete and inefficient.
The technical heart of the data strategy is the data warehouse. So, let’s take some time to expand on the concepts related to this and its optimization to optimize the queries that business intelligence analysts perform.
A data warehouse (DW or DWH), also known as an enterprise data warehouse (EDW), is a system for reporting and analyzing structured and semi-structured data from multiple data sources.

This is where our data is located and where we connect our visualization tools. The figure above shows that the data warehouse must have several layers. However, I will not explain in this article the different layers and components that must be included in the data warehouse. I will proceed with the topic of improving performance when consuming data.
To improve the performance of data queries, we must analyze three essential columns:
1. How we have stored our data
2. The human part.
3. The capacity or computing power to process the queries
Storage
Knowing how our data is physically stored and how our database engine retrieves is a starting point for any data project. Remember that in a very general way, we have two prominent types of structured databases: transactional and analytical.
Transactional databases focus on high performance for recurring insertions, changes, or deletions of small transactions, such as points of sale, call centers that contact different clients every minute and need to record data for each one, customer service, inventories, and any CRM and ERP. They are speedy with individual transactions. On the other hand, analytical engines focus on high-performance insertions or data queries of millions of records in minutes or seconds in batch processes. Neither is better than the other. They are focused on different use cases.
Snowflake is currently working on other storage formats to allow transactions; however, we want to analyze its characteristics as an analytical engine.
Physical data storage within Snowflake is based on the concept of micro partitions. A table logically represents data comprising one or more micro partitions. Each micro partition is a group of records ordered either by natural data ingestion or by an established cluster key that allows continuous data reordering according to the fields that make up the cluster key.
Considering this, our first step in optimization is to review the data ingestion processes and validate the order of the records that arrive through files or integrations. If this order corresponds to one of our query keys, we are already on the way to good optimization. If there is no key field to order the ingestion, we have two alternatives: the first and most efficient in terms of the long term would be to modify our processes for creating files that will be ingested into Snowflake. If this is not possible, we have the second alternative, creating a Cluster Key manually to indicate the order the data should have when physically stored.
This solves a use case for querying our data, preferably the most frequently used case. But what about users who query the data using another set of columns as key fields?
One feature of Snowflake is materialized views. You can create different materialized views, each with a distinct cluster key. The magic is that you can query them individually or the original table all the time, and the Snowflake query optimizer recognizes the key structures and clusters of the materialized views. Suppose the service detects that using the materialized view instead of the table is more efficient. In that case, it automatically rewrites the query and retrieves the data using the materialized view. This works with large tables in terms of Terabytes. In small tables, the data will constantly be retrieved directly from the object indicated in the SQL statement since the optimization is null or minimal.
When working on the data structure analysis process, we can identify other objects that can be very useful depending on the specific use case. Sometimes, we can rely on zero-copy cloning to have millisecond copies of the data in a table that we can use for testing or QA. In other cases, we can have dynamic tables in our intermediate layer or our data model layer that do not require customized update processes since they are designed to perform this task through the script that creates them, with the additional advantage over materialized views that they do allow having more than one table as data sources. Here are several links to Snowflake documentation to learn about the different types of objects that will enable you to store data.
Micro-partitions https://docs.snowflake.com/en/user-guide/tables-clustering-micropartitions
Cluster Keys https://docs.snowflake.com/en/user-guide/tables-clustering-keys
Materialized Views https://docs.snowflake.com/en/user-guide/views-materialized
Dynamic Tables https://docs.snowflake.com/en/user-guide/dynamic-tables-best-practices
Zero-Copy cloning https://community.snowflake.com/s/article/Best-Practices-for-Agile-Data-Deployment-using-Snowflake-Cloning-and-Access-Controls
Optimizing storage for performance: https://docs.snowflake.com/en/user-guide/performance-query-storage
Human part
From a human perspective, we will always be involved in some part of the process, whether at the beginning, designing the architecture of the entire process or writing code to carry out the whole data flow.
The first step is crucial: having a design on the general architecture of our solution so as not to go working and resolving issues that could be avoided, as well as thinking about integration with the entire data ecosystem, with other data products and considering all the points to manage the project within a framework that enables data governance. This part is developed by humans, where the experience and knowledge of data platforms and the tools used can provide a competitive advantage and improve implementation time.
Many warehouse implementation projects do not consider the design and architecture part, and although they are not destined to fail, they will have to overcome many challenges, which will increase the time and resources invested.
Another strategic point is the data architecture itself.
The data architecture within the platform must have at least three layers, starting with the RAW layer, also known as the STAGE layer, which covers the raw data ingested from our data sources.
The second layer is where we move our information by performing transformation and cleaning processes. We can combine various data sources and enrich the data. This is part of the ELT paradigm, where the transformations are performed directly in the data warehouse, not in the application that performs the ingestion.
Finally, we have our third layer, where we store the data in a form that tools and end users can consume. This is where we perform the modeling of the different data marts. Whether the data modeling method is Kimball, Data Vault, or another does not matter. The important thing is to have a layer where this activity is developed.
For security purposes, any data visualization or analysis tool and business analysts should connect to this final layer. Data scientists can often connect to the first layers because they need to run different models and experiments. However, any model that wants to be put into production must be connected to the data in the final, consumption, or modeling layers.
Another aspect of performance is the way the code is written. Programmers are used to using cursors; however, in many cases, cursors can be replaced with SQL code using grouping and conditional options. Cursors are effective for performing single transactions; an analytical data warehouse can process millions of records if the query is implemented correctly in a quarter of the time or less than that of a cursor.
Another common practice is including many subqueries levels within a query; this can make the query slow. Subqueries should not have order by.
No functions that transform data should be used in the where statements. Or at least we should avoid using them unless we have no alternative. A straightforward example is that we have a table with 20 million records, and we want to retrieve the records from October 1, 2024. The table has 25 micro partitions to complete the example, and the order_date is part of the cluster key. These two queries work:
Select id, order_date
from tabla1
where ‘2024-10-01’ = TO_VARCHAR(order_date, ‘yyyy-mm-dd’);
Select id, order_date_time
from tabla1
where TO_DATE(‘2024-10-01’) = order_date;
The difference is the response time. In the first example, for all records, 20 million, the date conversion is performed to determine which records should be displayed. The function is executed 20 million times, and the entire table is scanned. The function applied to the column does not allow the use of metadata from the micro partitions or the use of the Snowflake optimizer.
In the second example, the function is executed only once. The converted data is compared with the native value of the column. Additionally, it only scans a part of the table, only the micro partitions that have a date within the minimum and maximum of that column, which could be 5 instead of 25. This second query can take a quarter of the time or less than the first.
We can significantly reduce response time by applying best practices throughout our code.
Compute Power
I have left the processing power part for last because it is the most expensive. However, it is the easiest to configure and scale. For this reason, it is usually the first thing worked on to have short-term results but greatly increasing costs. A good performance analysis and its respective application must contemplate the previous stages first and lastly focus on the processing resource.
Snowflake offers different options. The first and easiest is to increase the size of our virtual warehouse, which comes in sizes XS, S, Medium, Large, and XL up to 6XL. Each size doubles the amount of resources but simultaneously doubles the cost.
If we have complex queries, many transformations, multiple joins, or a large amount of data recovered from a few queries, increasing the size is typically enough. However, having a lot of concurrency, whether it is many simultaneous users or many queries running simultaneously, could not be resolved by increasing the size. In this case, we must work on the multi-clusters instead of the size to opt for better results.
The concept of multi-clustering is to have a minimum number of servers running at a specific size that can increase as there is a demand for resources caused by more users or more queries, up to a maximum number of configured virtual warehouses.
Here, we can apply two types of policies: one that focuses on saving money (economy), where a new cluster is activated only if there are several queues, or the policy that optimizes time (standard), where queries are attended to but if any remain in the queue, a new cluster is activated as quickly as possible.
The number of queries a virtual warehouse can handle concurrently depends on its size and the “MAX_CONCURRENCY_LEVEL” setting. By default, a single-cluster warehouse can handle around eight concurrent queries, as this is the standard value for MAX_CONCURRENCY_LEVEL; larger warehouses can handle more concurrent queries due to increased computing power. Remember that the complexity of each query also affects how many can run concurrently.
The magic of multi-clustering is that you set up a minimum and maximum number of clusters, allowing you to control your budget. Snowflake automatically activates or deactivates them based on the increase in queries during your platform’s peak times of use.
This configuration is simple, but you should take the time to analyze your normal workload and during peak hours to determine the appropriate size and number of clusters required to handle concurrency peaks.
Other services within Snowflake, in combination with the warehouses, include the search optimization service, which allows you to accelerate queries to a table that does not have a specific query pattern. Some users perform queries using the cluster key, but many do not have a pattern. They can search by any column and retrieve small or medium amounts of records with specific queries. This service can significantly improve performance and the time required to return results.
The QAS, or Query Acceleration Service, is an option that you can activate in the warehouse settings. It can improve the speed of query execution by accelerating parts of the query workload and reducing the impact of outlier queries.
By default, it is disabled. Before activating it, it is necessary to analyze the queries that the warehouse regularly processes to take three possible options: the first is that it is not needed to activate it, the second is that the queries that we have in that workload are candidates to improve performance with this service or the third is that we must separate the warehouse into two workloads, that is, into two different warehouses, where one will have the queries that can be improved with this service and the other will resolve all the other types of queries.
Mult-cluster warehouses https://docs.snowflake.com/en/user-guide/warehouses-multicluster
Query Acceleration Service https://docs.snowflake.com/en/user-guide/query-acceleration-service
Search Optimization Service (https://docs.snowflake.com/en/user-guide/search-optimization-service https://docs.snowflake.com/en/user-guide/search-optimization/text-queries )
Optimizing warehouses for performance: https://docs.snowflake.com/en/user-guide/performance-query-warehouse
I hope I have given you an overview of the options Snowflake offers. Each has different impacts and improvements on our performance and, at the same time, our costs. However, an essential point is always that if our users and end customers are happy with the performance and use of our data warehouse, it means that we are moving in the right direction. If this is not the case, it is time to analyze why they are unhappy and whether this is related to our platform not responding in the expected time or because our data products take too long to reach the market.
You can use the official Snowflake documentation to guide you through these processes or contact us. We will happily assess your Snowflake environment and optimize it for performance and costs.
Victor Gomez
Principal Data Consultant
victor.gomez@pomerolpartners.com